


Keywords
cardiovascular magnetic resonance; hypertrophic cardiomyopathy; late gadolinium enhancement; myocardial strain; risk stratification; sudden cardiac death
Abbreviations
CMR: cardiovascular magnetic resonance
GLS: global longitudinal strain
HCM: hypertrophic cardiomyopathy
ICD: implantable cardioverter defibrillator
LGE: late gadolinium enhancement
SCD: sudden cardiac death
Take-home messages
- Imaging is central to sudden cardiac death risk stratification in hypertrophic cardiomyopathy and complements clinical risk scores.
- Left ventricular ejection fraction <50%, apical aneurysm, and extensive late gadolinium enhancement are incorporated into current guidelines but require nuanced interpretation.
- Late gadolinium enhancement refines risk assessment in low- and intermediate-risk patients, yet methodological heterogeneity limits its use as a standalone marker.
- Advanced markers such as scar heterogeneity and myocardial strain are promising but, as for LGE, require prospective validation before routine integration into future decision algorithms.
Introduction: the challenge of sudden cardiac death risk stratification in HCM
Hypertrophic cardiomyopathy (HCM) is the most common inherited cardiomyopathy and affects approximately one in 200 to 500 individuals. Sudden cardiac death (SCD) remains the most devastating complication of the disease. Although the annual SCD rate is approximately 0.8%, individual risk is highly heterogeneous. Identifying patients who are likely to benefit from prophylactic implantable cardioverter defibrillator (ICD) implantation while avoiding unnecessary device-related complications in low-risk patients remains a cornerstone of management. Imaging techniques, particularly echocardiography and cardiovascular magnetic resonance (CMR), are central to this evaluation.
Role of multimodality imaging in current guidelines-driven algorithms
The 2014 ESC HCM SCD risk score and updated guidelines approach
The 2014 European Society of Cardiology model introduced a formalised five-year risk calculator for SCD risk estimation. This model integrates clinical (age, family history of SCD, unexplained syncope, and non-sustained ventricular tachycardia) as well as echocardiographic variables, including maximal left ventricular (LV) wall thickness, maximal LV outflow tract (LVOT) obstruction gradient (either spontaneous or Valsalva manoeuvre-induced), and antero-posterior left atrial diameter acquired on para-sternal long axis view, into a quantitative estimate of five year risk (Figure 1).
Figure 1. Echocardiographic risk markers used in the 2014 ESC SCD HCM risk score.
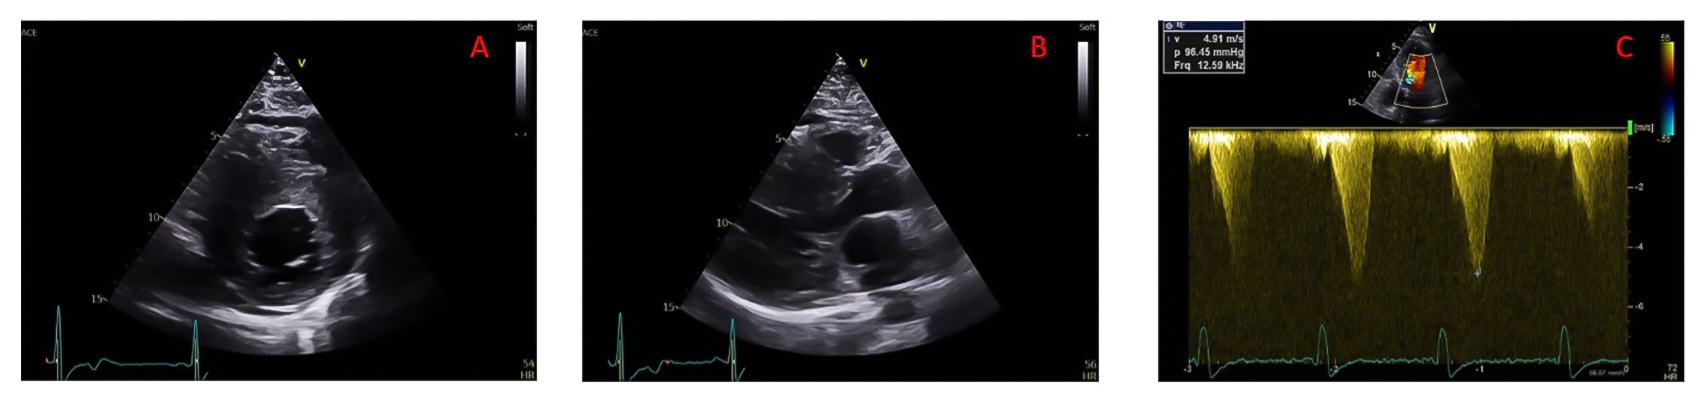
A) Parasternal short axis view in end-diastole to be used for measuring maximal LV wall thickness; (B) parasternal long axis view in end-systole to be used for measuring antero-posterior left atrial diameter; (C) Continuous wave Doppler measure of LVOT maximal gradient of obstruction.
LV: left ventricular; LVOT: left ventricular outflow tract
This approach represented a major advance compared with earlier binary strategies and allowed more nuanced patient selection for ICD implantation. However, subsequent validation studies demonstrated several limitations. Sensitivity in low and intermediate risk groups was modest, and a substantial proportion of sudden cardiac death events occurred in patients classified as low risk [1]. These observations underscored the need to refine risk stratification with additional markers, particularly imaging-derived variables that may more directly reflect arrhythmogenic substrates.
More recent guidelines, including the 2020 and 2024 American College of Cardiology [2] and American Heart Association recommendations and the 2022-2023 European Society of Cardiology guidelines on ventricular arrhythmias, prevention, and cardiomyopathy management, have incorporated additional imaging-based risk markers. These include left ventricular ejection fraction (LVEF) below fifty percent, the presence of a left ventricular apical aneurysm, and the extent of myocardial scars assessed from late gadolinium enhancement sequences on cardiac magnetic resonance [3,4].
Imaging risk factors beyond the ESC HCM-SCD risk score
Left ventricular systolic dysfunction
Hypertrophic cardiomyopathy is classically described as a hyperdynamic disease. However, a subset of patients develops systolic dysfunction with left ventricular ejection fraction below fifty percent. Even a modest LVEF reduction of <50% identifies patients with increased risk of both heart failure progression and ventricular arrhythmias [5]. Its incorporation into recent ACC/AHA and ESC guidelines emphasises its strong prognostic significance.
Apical aneurysm
Left ventricular apical aneurysms are detected in approximately three to five percent of patients when systematically assessed by cardiovascular magnetic resonance. They are characterised by thin-walled, akinetic or dyskinetic apical segments, often associated with mid-ventricular obstruction (Figure 2A).
Apical aneurysms are clinically relevant for several reasons. They are associated with thromboembolic risk, progressive systolic dysfunction, and ventricular arrhythmias, particularly sustained monomorphic ventricular tachycardia. However, interpretation of their independent prognostic value requires caution. Many sudden cardiac death events reported in aneurysm cohorts correspond to appropriate ICD therapies for sustained ventricular tachycardia rather than ventricular fibrillation. In addition, patients with apical aneurysm frequently exhibit concomitant high-risk features such as reduced LVEF [6].
Therefore, although apical aneurysm represents an important marker of advanced structural disease, it was not retained as an independent additional risk factor to consider on top of the ESC HCM-SCD risk score outlined in the 2022/2023 guidelines.
Late gadolinium enhancement and scar burden
Late gadolinium enhancement (LGE) detected by cardiovascular magnetic resonance reflects focal replacement fibrosis (Figure 2B). Numerous studies have demonstrated that the presence of LGE is associated with increased risk of SCD and appropriate ICD therapy, but LGE presence is frequent in HCM patients, reported in 61% in a meta-analysis of 11 studies having included a total of 5550 patients [7].
Figure 2. CMR examples of apical aneurysm and late gadolinium enhancement.
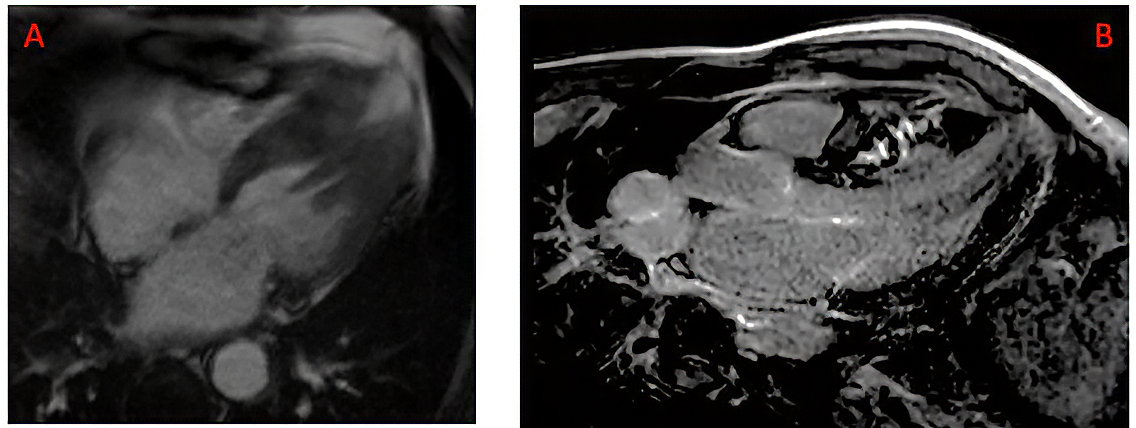
A) Ciné long axis 4 chamber view in end-systole showing the presence of an apical aneurysm; (B) Late gadolinium enhancement of mid-wall distribution located in the interventricular septum. CMR: cardiovascular magnetic resonance
LGE extent correlates with arrhythmic events, supporting its use as a quantitative risk marker. This evidence led to the incorporation of extensive LGE into contemporary risk algorithms but several important considerations apply to the current use of this parameter for risk stratification in HCM.
Current ESC guidelines define extensive fibrosis at increased risk of SCD as LGE involving 15 percent or more of left ventricular mass. This threshold emerged from the first observational data showing higher arrhythmic event rates above this level [8,9]. However, other studies identified lower thresholds of 5 or 10% LGE extent for adequately identifying HCM patients at risk of SCD.
These discrepancies across different studies can be explained by a lack of standardisation for LGE extent detection and quantification. Several methods exist for LGE quantification, including standard deviation thresholding, full width at half maximum techniques, and manual contouring. Although predictive performance appears broadly similar across methods, inter-centre variability persists.
Standardisation of acquisition protocols and quantification techniques remains essential for future integration into refined quantitative risk calculators. In a 2024 meta-analysis by Kiaos et al, the best-performing LGE threshold appeared to be 10% extent of the myocardium with a standard deviation thresholding of 6 SD.
On the other hand, patients with lower degrees of LGE extent may still experience arrhythmic events. The relationship between fibrosis burden and arrhythmic risk appears continuous rather than binary, and risk increases progressively with greater LGE extent rather than abruptly beyond a single cutoff [1], underlying the need to better define LGE patterns at risk of SCD through a multiparametric LGE characterisation approach.
Given the current limitations of LGE assessment, including the lack of standardisation in quantification methods, the variability of reported thresholds depending on the technique used, and the ongoing uncertainty regarding the relevance of a single universal cutoff, LGE cannot yet be considered a standalone risk marker. The absence of harmonised protocols makes interstudy comparisons difficult and limits the robustness of a fixed percentage threshold across centres. For these reasons, LGE is currently best regarded as a second line tool. ESC clinical practice guidelines recommend its use to refine SCD risk stratification in patients initially classified as low- or intermediate-risk according to the ESC HCM SCD score, rather than to independently determine ICD indication (see Figure 16 of 2023 ESC Guidelines for the management of cardiomyopathies [4]).
Refining risk prediction: emerging imaging markers and future directions
Scar distribution and architecture
Beyond total fibrosis burden, attention is focusing on scar distribution and heterogeneity. Dense scarring may be electrically inert, whereas heterogeneous border zones containing interspersed viable myocardium may facilitate re-entry circuits. Recent analyses suggest that measures of scar heterogeneity and border zone mass may provide incremental prognostic information beyond a simple assessment of fibrosis percentage [10].
A more easily and daily applicable multiparametric LGE characterisation method, using specific scar locations, such as septal mid-wall fibrosis, may carry particular arrhythmic significance. The concept of LGE granularity integrates the extent, location, and pattern of fibrosis. Early data indicate that such composite approaches improve discrimination compared with extent alone. Although not yet incorporated into formal guidelines, these findings suggest that future risk models may incorporate scar texture rather than simple volumetric thresholds.
Myocardial deformation imaging
Global longitudinal strain measured by speckle tracking echocardiography or feature tracking CMR reflects longitudinal myocardial function and detects subtle systolic impairment even when ejection fraction is preserved.
In hypertrophic cardiomyopathy, reduced GLS correlates with fibrosis burden and adverse remodelling. Several studies have demonstrated that impaired GLS predicts sudden cardiac death events and appropriate ICD therapy. Thresholds around –13% have been associated with increased arrhythmic risk [11], but the independent predictive value for SCD remains to be definitively established. As for LGE, most available data derive from observational cohorts and heterogeneous methodologies. In addition, strain measurements are also influenced by vendor-specific software and acquisition variability, which complicates standardisation across centres.
Before these promising multimodality imaging tools (deformation imaging, LGE, and other CMR-derived parameters) can be incorporated as additional risk markers within current decision-making algorithms, robust prospective validation demonstrating incremental and independent prognostic value beyond established clinical and imaging variables is required, and such studies are currently ongoing (NCT 03846297).
A practical multiparametric imaging strategy
In daily clinical practice, imaging-based risk evaluation should follow a structured and integrated approach.
Comprehensive echocardiography should assess maximal wall thickness, outflow tract obstruction, left ventricular ejection fraction, left atrial size and, where available, myocardial strain.
Cardiovascular magnetic resonance should be performed in most patients to provide precise mapping of hypertrophy, detect apical aneurysm, confirm systolic function and quantify late gadolinium enhancement. Particular attention should be paid not only to total fibrosis burden but also to scar distribution.
Imaging findings must then be integrated with clinical risk markers such as family history, syncope and documented ventricular arrhythmias through the ESC HCM-SCD risk score and 2022/2023 ESC SCD and Cardiomyopathies guidelines algorithms [3,4]. This integrated approach is particularly important in patients with intermediate calculated risk, where additional imaging markers may influence the balance toward or against ICD implantation for informed and shared decision-making with the patient.
Conclusion and impact on practice
SCD prevention in HCM requires an individualised and multiparametric approach. Imaging has become a central component of risk stratification, complementing clinical scores. LV dysfunction, apical aneurysm, and extensive LGE are now embedded in contemporary guidelines, yet important limitations remain, particularly regarding LGE quantification and threshold definition. Advanced markers such as scar heterogeneity and myocardial strain are promising but not yet fully validated. In daily practice, integrating echocardiography and CMR findings with guideline-based algorithms is essential to support balanced, shared decision-making regarding ICD implantation, pending the ongoing prospective studies that should identify independent risk markers for use in future stratification algorithms.

