Introduction
The ESC recommends echocardiography as the key method for diagnosis of aortic valve disease (AVD) while other non-invasive imaging methods and cardiac catheterisation are recommended as verifying methods in case of doubt/discrepancies in echocardiographic findings [1, 2].
These recommendations rely on the wide availability and very good feasibility of echocardiography for most patients. Moreover, estimation of the severity of AVD with transthoracic echocardiography is best validated and correlates well with clinical outcomes. Further, echocardiography is still the reference method for emerging modalities for diagnosis of aortic valve disease such as magnetic resonance [1, 2].
Aortic Stenosis
Principles of Diagnosis with Echocardiography and Other Methods
Aortic stenosis (AS) implies a reduced aortic valve area (AVA). Thus, for its diagnosis, evaluation of AVA and imaging of any morphologic abnormality that can cause reduction in AVA are needed.
Current methods used in assessing AVA are as follows:
- Transthoracic echocardiography (TTE) with classic two-dimensional (2D) or a more modern three-/four-dimensional modality (3/4D).
- Transoesophageal echocardiography (TOE), both 2D and 3/4D.
- Cardiac magnetic resonance (CMR) including 3/4D and velocity-encoded imaging.
- Cardiac computed tomography (CCT).
- Cardiac catheterisation (CC).
All these methods are either used or better validated for indirect estimation of AVA rather than direct measurement of geometric AVA. Only 3/4D TOE and 3/4D CMR seem to be promising regarding reliable direct geometric calculation of AVA [2, 3].
The indirect estimation of AVA with all of the above-mentioned methods assumes a typical response of the left ventricle (LV) to reduced aortic valve opening. Moreover, estimation methods generally assume only one pathology such as AS and need correction in case of the coexistence of other abnormalities [3, 4]. These assumptions are therefore quite often not true in real life; this has recently been proved at least in the case of so-called low-gradient severe AS with preserved LV ejection fraction (LVEF).
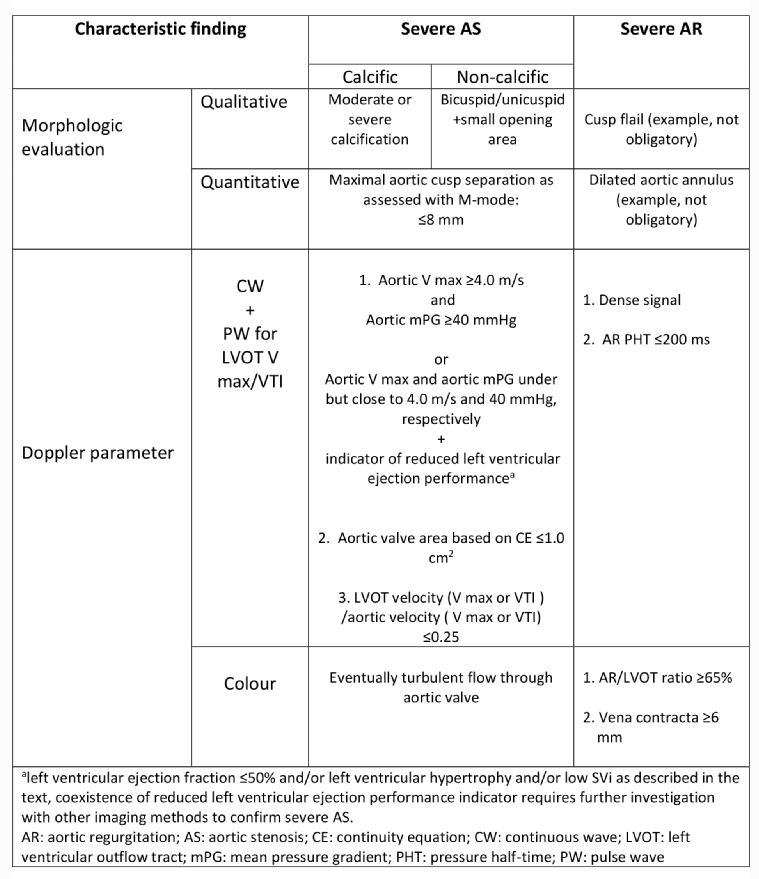
TTE imaging is usually enough not only to detect aortic valve morphologic abnormality that can lead to valve stenosis, but also to help to qualify its grade initially. The extended valve calcification in calcific stenosis suggests a more advanced stenosis. Cusp separation visualised with M-mode recording can be useful and seems to be quite a reliable method for recognition of severe AS. Maximal separation of the aortic cusps, defined as the inner edge distance measured in a parasternal long-axis or alternatively short-axis view at mid-systole with a cut-off below 8 mm, predicts severe AS with high sensitivity and specificity approaching 90% and 95%, respectively [5, 6].
Geometric measurement of AVA with 2D TTE/TOE, known as planimetry, is neither simple nor perfect due to the complex geometry of the aortic valve [1], because the aortic valve orifice, especially a stenotic one, is not flat. Volumetric quantification with a 3D/4D modality, particularly TOE, enables a more reliable measurement of geometric AVA. Unfortunately, volumetric calculations of AVA are more challenging and less reliable in cases of severe calcific stenosis compared with mild or moderate calcific AS. On the other hand, volumetry of non-calcific AS, as in the case of a bicuspid valve, still seems to be reliable in severe AS [3, 7, 8].
Doppler assessment of flow through the aortic valve is always included in echocardiographic AS grading. Reduced AVA suggested by abnormal valve morphology can be confirmed by abnormally increased peak velocity (Vmax) through the aortic valve and increased mean transvalvular pressure gradient (mean PG) as obtained with the continuous wave Doppler (CWD) modality. The mean PG comes from the averaging of all instantaneous gradients over the whole ejection period of the LV and in daily practice is easily obtained from manual or automatic tracing of the CWD signal of AS with the help of calculating software in current echocardiographic equipment.
According to the rule of thumb, higher V max/higher mean PG indicates a greater reduction of AVA if LV ejection performance is normal. This rule is mechanistically explained by a continuity equation which is based on the flow continuity concept through the heart with normal ejection performance as assessed with EF and stroke volume (SV).
The continuity concept means that flow volumes through different parts of the cardiovascular system are equal and that neither congestion nor loss occurs. Because volume can be calculated as a product of cross-sectional area and velocities over the flow time (mathematically velocity-time integral [VTI]), the reduction in area implies an increase particularly in velocity to maintain the same volume while flow time is more constant. Thus, AVA is derived from the following continuity equation (CE):
AVA = LVOTA x LVOT VTI ̶ AV VTI , where LVOTA is the left ventricular outflow tract (LVOT) area, LVOT VTI is the velocity time integral (VTI) in the LVOT, and AV VTI is the VTI of the aortic valve.
In daily practice, the LVOT area is calculated from the LVOT diameter according to the formula that squares all potential inaccuracies in diameter measurement. This can result in a poor estimation of the AVA. Once again, 2D TOE or a 3D/4D modality seems to be better for LVOT measurements but it is not feasible in everyday practice. Moreover, the CE estimates not the geometric AVA but in fact the flow area called the effective orifice area (EOA)of the aortic valve.
To avoid multiple CE inaccuracies, LVOT V max/AV V max ratio can be used as a good surrogate for the CE with a value of 0.25 as the upper limit for severe AS indicating an AVA not greater than 1.0 cm2. Likewise, an AV Vmax of 4.0 m/s and mean PG of 40 mmHg are considered as the lower velocity/mean gradient limit for severe AS in most clinical scenarios according to the rule of thumb mentioned above.
Due to all the approximations and limitations of the echocardiographic method, the combination of visual assessment and haemodynamic parameters, the so-called integrative approach, is needed to grade AS accurately. Only complete consistency between simple visual assessment of valve morphology and the relevant grade of increase in Vmax/mean PG allows for an accurate diagnosis. This means that an advanced morphologic abnormality, if accompanied by high values of haemodynamic parameters typical of severe AS, allows the reliable diagnosis of severe AS. On the other hand, a moderate or mild morphologic abnormality accompanied by a V max/mean PG well below the lower limits for severe AS, respectively under 3.0 m/s and 20 mmHg, allows the exclusion of severe AS even without using the CE [1, 2].
Vmax/mean PG are subject to confounders such as abnormally low or abnormally high flow volumes through the valve. This phenomenon is widely known as flow dependence of V max/mean PG and results in subsequent flow-dependence of AVA estimation based only on aortic valve velocities. Velocity ratios, i.e., LVOT V max/AV V max and LVOT VTI/AV VTI, are less sensitive to flow changes and thus are recommended in case of the presence of confounders [1-4].
Hyperkinetic circulation or aortic regurgitation [3, 4] can overestimate the severity of AS due to higher than normal flow through the aortic valve and therefore higher V max and sometimes even higher mean PG across the aortic valve despite a normal AVA. Another potential confounder of the CWD-based method is vascular resistance. High vascular resistance (VR) theoretically blunts the increase in V max/mean PG across the aortic valve and thus overestimates AVA/underestimates AS as assessed by CE [3].
Although congestion excludes the operation of the continuity concept in the failing heart, the CE is still regarded as being valid for estimation of AVA based on the LVOT/AV velocity ratio. This is because normally no congestion occurs in the LVOT and all velocities downstream from a failing LV decrease proportionally so that the LVOT V max/AV V max ratio remains conclusive. Thus, the velocity ratio, being less flow-dependent than V max/mean PG, can still be used for AVA estimation in cases of poor ejection performance. The imperfection and internal discordance of the continuity concept result in the distinguishing of low-gradient severe AS entities where V max/mean PG is inconsistently low in relation to a visually severe abnormal valve or AVA ≤1.0 cm2, as estimated with CE or a surrogate of CE:
1. Low-flow, low-gradient (LF-LG) severe AS with reduced LVEF and/or reduced stroke volume indexed to body surface area (respectively, EF ≤50% and/or SVi ≤35 ml/m2). EF and SVi calculation methods are described elsewhere [1-3].
To this entity belongs severe AS with concomitant heart failure with reduced EF (HFrEF). Likewise, severe AS in the setting of low SVi due to heart failure with preserved EF (HFpEF), which is indicated by echocardiographic findings such as small LV volumes or increased LV wall thickness, belongs here as well [1-3]. Similarly, a significant mitral regurgitation can result in reduced forward SVi [4].
2.Normal-flow, low-gradient (NF-LG) severe AS with both normal LVEF and SVi.
A suboptimal acoustic window underestimating V max/mean PG can be one reason for NF-LG severe AS. Another scenario, although still controversial, is low-gradient severe AS due to an unfavourable flow rate and otherwise normal flow. Flow rate is defined as cardiac output in relation to the whole systolic ejection period over one minute [9, 10].
Thus, any inconsistency in the integrative assessment of AS requires a search for confounders/disturbed flow and verification of AS severity [1-3]. All verifying methods attempt either to confirm a high degree of morphologic abnormality or to quantify SVi better.
The former seems to be feasible with CMR in cases of non-calcific AS and with CCT in calcific AS. The latter, namely direct haemodynamic measurement of volumes such as SVi, is possible with CC and with CMR [1, 3, 11].
Like SVi, the pressures in the LV and in the aorta are directly measured with CC and are used for AVA quantification. However, CC-based AVA calculation relies on the same assumptions as echocardiographic CE and thus does not offer more reliable results, particularly under low-flow conditions. Normally, systolic pressures in the ascending aorta and the LV equilibrate very fast without a significant gradient and reach their peaks simultaneously. In cases of reduced AVA, the pressure gradient between the LV and the aorta occurs with a lower and delayed peak in the aorta than in the LV.
Theoretically, the more severe the AS, the higher the LV aorta pressure gradient is. This is described by the Gorlin formula and its Hakki modification used for estimation of AVA with CC [12, 13]. The Gorlin equation in its simplified form, known as the Hakki equation, is as follows:
where CO is the cardiac output in L/min, P1-P2 is the mean time-averaged pressure gradient across the aortic valve in mmHg, and ¤ is the division by 1.35 applied with a heart rate over 90 beats per minute.
The pressure gradient is flow-dependent and underestimated with CC in the case of low CO. Underestimation of the pressure gradient can severely underestimate AS, even with low cardiac output.
Likewise, CMR employs a modified CE or modified Gorlin formula for haemodynamic measurement of EOA/AVA. However, CMR has been shown to have the lowest intraobserver and interobserver variability in assessing AVA compared with TTE, TOE and CCT [14]. Moreover, the sensitivity and specificity for detection and correct grading of AS is highest for CMR among non-invasive methods [14].
Risk Stratification with Echocardiography
The degree of valve calcification accurately predicts clinical outcome defined as the need for aortic valve replacement, heart failure development and death but is best estimated with CCT not echocardiography [1].
Echocardiography points to other risk factors that are of value in asymptomatic AS. Aortic V max at a level of 5.5 m/s or higher predicts adverse events in asymptomatic patients and thus is included in the ESC recommendations as an independent indication for valve replacement [1, 2].
Besides V max and other previously known echocardiographic poor outcome predictors such as reduced LVEF or grade of LV hypertrophy which are described in detail elsewhere [1, 2], novel prognostic parameters have emerged with the advent of tissue Doppler.
Speckle tracking echocardiography seems to be best validated in terms of risk stratification as a sensitive marker of systolic dysfunction caused by AS.
2D LV global longitudinal strain (2D LV GLS) has been studied most extensively. Cut-off values equal to or higher than -18.2% (absolute values equal to or lower than 18.2%) are considered to indicate poor prognosis in asymptomatic patients with severe AS in the V max range up to 5.5 m/s and with normal LVEF. Therefore, patients with 2D LV GLS ≥ -18.2% run a higher risk of developing AS symptoms and thus a need for intervention [15].
Likewise, 3D LV GLS with a value over -14.5% has been shown to be a risk factor predicting poor clinical outcome in asymptomatic severe AS. In contrast to 2D LV GLS, a 3D value is an independent risk factor after correction for wall hypertrophy and V max [16].
Only CMR can supply similar information to LV GLS on myocardial changes accompanying AS before symptom occurrence. Moreover, CMR is better than echocardiography for diagnosis of heart muscle comorbidities such as amyloidosis that influence prognosis after valve replacement. Thus, CMR seems to be a most promising novel imaging method for the assessment of AS [11].
Aortic Regurgitation
Principles of Diagnosis with Echocardiography and Other Methods
The perfect parameter that quantifies aortic regurgitation (AR) is blood volume regurgitant to the LV. This volume can be expressed as absolute regurgitant volume (RVol) or regurgitant fraction (RF) of forward LV SV. The proximal isovelocity surface area (PISA) method is used to calculate RVol further indexed to LV SV which gives RF, as described elsewhere [1-3]. In short, RF is a product of the effective regurgitant orifice area (EROA) derived from PISA and the VTI of an AR CWD signal. However, the PISA method is time-consuming, load-dependent and indirect, and thus easily subject to measurement errors.
Nowadays, CMR offers direct LV volume and flow measurements and is better for the direct evaluation of AR by RVol/RF if a combination of the three parameters described below is discordant regarding AR severity [1, 17].
Jet visualisation with colour Doppler (CD) is used to calculate the first two of them, while the third one is based on CWD. The first parameter quantifying AR is called the AR/LVOT ratio. It is the maximal AR jet width taken just below the aortic annulus divided by the LVOT width taken at the same level. The ratio cut-offs ≤25% for mild and ≥65% for severe AR have been shown to correlate highly with the old gold standard, namely angiographic grade I and IV/V, respectively [18].The next CD-based index of AR severity is the vena contracta which is the part of the AR jet directly distal to the regurgitation orifice. A value of 6 mm or more strongly suggests severe AR [17].
The AR pressure half-time (PHT) is a PHT of AR measured from the CWD signal. This parameter describes the speed of pressure equilibration between the aorta and the LV during diastole. The rule of thumb says that the more violent the regurgitant flow, as in severe AR, the shorter the AR PHT. Because AR PHT is highly load-dependent, it less correctly assesses AR severity compared to CD-based methods. However, AR PHT shorter than 200 ms and greater than 500 ms quite specifically indicates severe and mild AR, respectively [17].
The coexistence of relevant holodiastolic flow reversal, as detected with pulsed wave Doppler in the descending aorta, confirms severe AR as indicated by CD and CWD parameters [17].
Risk Stratification with Echocardiography
Echocardiography allows risk stratification in AR as assessed by LVEF and LV diameters during systole and diastole. An LVEF below 50%, LV end-diastolic diameter ≥70 mm or LV end-systolic diameter ≥50 mm all are considered to indicate poor prognosis in asymptomatic severe AR accurately [1].
As in AS, prognostication with LV GLS is emerging. A 2D LV GLS value of ≥18.5 has been shown to indicate worse prognosis in asymptomatic severe AR [19].
Conclusions
The usefulness of echocardiography for the accurate grading of AS is limited by the highly assumptive character of the flow continuity concept. Cautious visual evaluation of valve morphology is recommended and should result in further non-invasive imaging if a low gradient coexists with morphology suggesting severe AS.
Echocardiography is usually enough for the reliable assessment of AR. In case of doubt, CMR is recommended.
Tissue Doppler with LV GLS is advocated for risk stratification in asymptomatic AVD.
Table 1 below summarises the echo-based assessment of severe AVD.