


Abbreviations
LV: left ventricle
LVOT: LV outflow tract
MR: mitral regurgitation
MS: mitral stenosis
MV: mitral valve
PISA: proximal isovelocity surface area
RF: regurgitant fraction
ROA: regurgitant orifice area
RV: regurgitant volume
VTI: velocity time integral
Echocardiography in mitral regurgitation
Mitral regurgitation (MR) is one of the most common acquired valvular heart diseases. Echocardiographic assessment of MR provides insight into the mitral valve (MV) and plays an important role in:
- Assessment of MV anatomy to understand the aetiology and mechanism of MR.
- Assessment of MR severity.
- Detection of impact on LV cavity size and overall function.
- Guiding the selection of therapeutic strategy.
Assessment of MV anatomy
A detailed anatomical description of the MV is a crucial part of the assessment of MR. All of the components of the MV apparatus including the leaflets, annulus, chordae, papillary muscles, and left ventricle (LV) have to be evaluated carefully by echocardiography. Based on this evaluation, it is possible to differentiate between primary and secondary chronic MR. In chronic primary MR, the involvement of one or more of the components of the valve (leaflets, chordae tendineae, papillary muscles, annulus) can cause MR. In chronic secondary MR, the MV is usually normal and the underlying mechanism is severe LV dysfunction that leads to papillary muscle displacement and leaflet tethering with associated annular dilation that prevents coaptation.
In chronic primary MR, echocardiography helps in:
- Detailed assessment of the MV leaflets to diagnose prolapsed scallop(s), flail leaflet, perforation, vegetation, etc.
- Detailed assessment of the subvalvular apparatus to diagnose ruptured chordae, ruptured papillary muscle.
In chronic secondary MR, echocardiography helps in:
- Volumetric measurement of LV size and ejection fraction.
- Assessment of global and regional wall motion abnormalities of the LV.
- Tethering of the MV leaflet due to papillary muscle displacement.
- Symmetric or asymmetric mitral annulus dilatation.
Assessment of MR severity
Many parameters (qualitative, semi-quantitative and quantitative) can be used to define the severity of MR. None of them can be relied on solely for the definition. An integrative approach to include most of them is a must to achieve accurate diagnosis and overcome the pitfalls and limitations of each parameter [1].
Qualitative assessment
In addition to the detailed morphologic description of MV apparatus, the following echo findings can identify the presence of significant MR but not assess its severity.
Density of MR signals
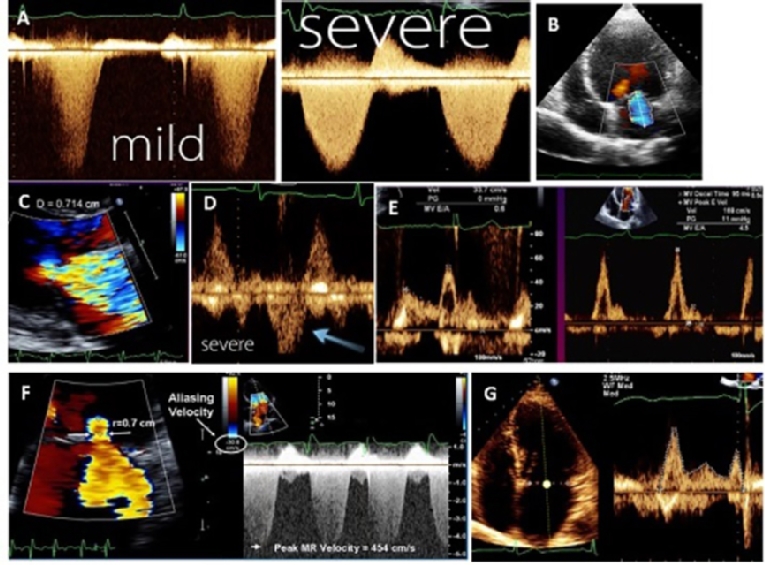
Using continuous wave Doppler, if the signal is similar in density to that of antegrade flow, this suggests significant MR, whereas a faint signal or an incomplete envelope is typical of mild MR (Figure 1A).
Colour flow jet of MR
A colour Doppler imaging MR jet indicates the presence of MR. Appropriate adjustment of the gain setting is important to avoid underestimation and overestimation of MR severity. It can help in understanding the mechanism of MR through the direction of the MR jet. For example, in MR secondary to leaflet tethering, the regurgitant jet points towards the restricted leaflet, while in MV prolapse the regurgitant jet points away from the prolapsed leaflet. Measurement of the MR jet area alone or indexed by left atrium area is not valid for the severity because the jet area is very dependent on the mechanism of MR and usually underestimates the severity with the eccentric jet. In case of a normal MV structure, normal LV and LA size, a small central jet area of <4.0cm2 (or <10% of LA area) in multiple views is usually mild MR (Figure 1B).
Semi-quantitative assessment
The following echo parameters help to identify the severity of MR but each one has limitations and pitfalls [2]. These include:
Vena contracta (VC) width
The VC is defined as the smallest, highest-velocity region of a flow jet and is typically located at or just below the regurgitant orifice. Its width should be measured in a long-axis imaging plane perpendicular to the mitral leaflet closure. The VC is independent of flow rate and driving pressure. It can be used for central and eccentric jets and is accurate in acute MR. However, it is not valid for multiple jets. A VC width <0.3 cm denotes mild MR and a VC width >0.7 cm is specific for severe MR. Intermediate values of VC width (0.3-0.7 cm) do not mean that MR is moderate; confirmation by other quantitative methods is needed (Figure 1C).
Pulmonary venous flow reversal
Reduced systolic velocity in >1 pulmonary vein and even reverse flow indicates severe MR. However, increased left atrial pressure of any cause can result in blunted pulmonary venous systolic flow (Figure 1D). Absence of flow reversal should not be used for exclusion of significant MR. It can be false negative if the jet is directed away from pulmonary veins, e.g., highly eccentric MR and/or severely dilated left atrium. On the other hand, if the MR jet is small but eccentric and directed towards the pulmonary vein, blunted or reverse flow can be recorded in this pulmonary vein (false positive).
Peak velocity of E-wave of MV inflow
Using pulsed Doppler at the tip of the MV, early filling (E-wave) usually dominant (E velocity >1.5 m/s) indicates severe MR due to increased forward flow across the MV. If the A-wave is dominant, severe MR can be excluded (Figure 1E).
Regurgitant index
A non-geometric pulsed Doppler index, namely the mitral to aortic velocity-time integral (VTI), is used for quantification of pure isolated organic MR. A ratio ≥1.4 defines patients with severe MR with a sensitivity of 87%, and a specificity of 91%.
Quantitative assessment
These parameters carry more accuracy for the definition of severe MR. They include:
Effective regurgitant orifice area (Figure 1F).
The flow acceleration proximal to the regurgitant orifice results in a concentric proximal isovelocity surface area (PISA). PISA is based on the fact that, near the regurgitant orifice, the blood is disposed in hemispheric layers, having the same velocity at a certain distance from the orifice. Lowering the velocity at which aliasing appears to 15-40 cm/s, all the “layers” with a higher velocity will have the aliasing phenomenon. Measuring the first aliasing hemisphere is a marker of regurgitation degree [3]. PISA measurement requires a narrow sector of colour with zoom mode and a shift of the Nyquist limit to be between 15-40 cm/sec. Four formulas are used for calculation:
- PISA = 2πr2 (assuming that PISA is a hemisphere).
- Regurgitant flow rate (RFR) = PISA x aliasing velocity (which is equal to the Nyquist limit on the colour scale).
- Regurgitant orifice area (ROA) = RFR/max MR velocity. Effective ROA (EROA) <0.20 cm2 indicates mild MR and ≥0.40 indicates severe MR.
- Regurgitant volume (RV) = ROA x velocity time integral (VTI) of MR. RV <30 ml/beat indicates mild MR while ≥60 ml/beat indicates severe MR.
Volumetric measurement
Quantification of RV and regurgitant fraction (RF) is based on calculation of stroke volume (SV) across the MV and across another non-regurgitant valve (aortic or pulmonic). The formula used for SV calculation is: SV=cross-section area x VTI (Figure 1G). Subtraction of the SV obtained at two sites is used to calculates RV. RF is calculated as a percentage of RV to SV across the MV. RF <30% indicates mild MR while ≥50% indicates severe MR. ROA can also be obtained by the formula: ROA= RV/VTI of MR. To calculate SV across the aortic valve, a parasternal long-axis view is used to measure LV outflow tract (LVOT) diameter at the level of the aortic valve annulus, just proximal to the cusps, and an apical 5-chamber view to measure the VTI of the LVOT using pulsed wave Doppler placing the sample volume at the level of the same point where the LVOT diameter was measured. To calculate SV across the MV, an apical 4-chamber view is used to measure the MV annulus diameter and to measure the VTI of the MV using pulsed wave Doppler placing the sample volume at the tip of the leaflet.
Figure 1. Methods used for MR quantification. Continuous Doppler tracing showing dense signal with severe MR and faint with mild MR (A), tracing of MR jet area (B), width of vena contracta (C), reversal of pulmonary venous flow (D), dominant E-wave of mitral inflow in severe MR (E), calculation of MR using PISA method (F), and volumetric measurement of stroke volume across the MV (G).
The criteria used to define severe MR using previous parameters are displayed in Table 1. Considering the profound deleterious effect of ischaemic MR, the cut-off levels of severity are lower than in organic MR [4].
Table 1. Echocardiographic semi-quantitative and quantitative parameters used to define severe MR.
| Semi-quantitative assessment | Definition | |
|---|---|---|
|
≥7 (>8 for biplane) | |
|
systolic reversal | |
|
E-wave velocity ≥1.5 m/s | |
|
TVI mitral/TVI aortic >1.4 | |
| Quantitative assessment | Primary | Secondary |
|
≥40 | ≥20 |
|
≥60 | ≥30 |
Technical considerations
- To optimise the measurement of VC, the view that is perpendicular to the jet width such as parasternal long-axis or 4-chamber views should be used. Using the apical 2-chamber view, which is oriented parallel to the line of leaflet coaptation, a wide VC may show even in mild MR [5].
- In ischaemic MR, the assessment of VC width should be carried out in two orthogonal planes (e.g., parasternal and apical four-chamber) and an average of these two should be reported due to the elliptical shape of the regurgitant orifice.
- In multiple jets, both VC width and PISA are not additives and cannot be used.
- In eccentric jets, the largest PISA is to be found in the parasternal long-axis view, while in central jets the apical 4-chamber view should be used.
- If PISA is not a typical hemisphere, the severity of MR can be overestimated (e.g., if it is flattened) or underestimated (e.g., if it is oval).
- Volumetric quantification by Doppler is used as an additive to PISA and VC but not as a first-line method because it is time-consuming.
Transoesophageal echocardiography (TOE)
As a general rule, 2D transthoracic echocardiography (2D-TTE) is enough for the assessment of MR severity and clarification of the mechanism. If the image quality is not good enough to obtain a detailed assessment of either the MV anatomy and/or the grading, TEE is an alternative. Before MV surgery, TEE is usually required for better understanding of the mechanism of MR and selecting the proper reparative strategy or replacement according to the descriptive morphology of the MV apparatus. Post MV repair, intraoperative TEE is needed for assessment of the outcome [6,7].
3D echocardiography
The development of probe technology and software has enabled better assessment of MR using 3D echo, especially TEE. 3D echo can help through:
Morphologic assessment.
In organic MR, an "en face" view of the MV from both atrial and ventricular aspects can be easily displayed using 3D echo. This helps in detailed visualisation of the anatomic features of the MV apparatus. It has been proved that 3D echo is highly accurate and reproducible in localising prolapsing scallops. In functional MR, 3D echo enables the quantification of the extent of MV apparatus distortion. An anatomical module can be displayed using the MV quantification software that helps to understanding better the MV annulus geometry (excursion, shape and curvature), leaflet surface, tethering distance, tenting volume, and relation between MV and papillary muscles [7]. Not only qualitative assessment but also many of the parameters can be obtained including:
- Quantification of the MV annulus (diameters, area and dynamics).
- Measurement of leaflet (length, area, volume and height of prolapse).
- Calculation of tenting (distance and volume).
The 3D qualitative and quantitative assessment of MV anatomy helps in differentiating the mechanisms of regurgitation in ischaemic and dilated cardiomyopathy and helps in repair planning to restore the annulus geometry and achieve better leaflet coaptation [5].
Quantification of MR.
3D echo quantitative measurements for grading of MR include [8]:
- Planimetry of VC area. This is considered a very precise quantitative method due to the "en face" visualisation of the real shape of the VC in a short-axis view. 3D echo can be a solution for assessment of the VC in ischaemic MR. A 3D VC area of 0.41 cm2 defines severe MR (irrespective of aetiology).
- Direct measurement of the true anatomic ROA.
- Improved accuracy of EROA calculation using PISA through avoiding geometric assumption.
- Accurate quantification of SV along the whole cardiac cycle.
Stress echocardiography
This is indicated if there is a discrepancy between symptoms and the severity of MR at rest, e.g., symptomatic patients with chronic primary MR which is not severe by echo. It is also indicated in asymptomatic patients with severe MR and “preserved” resting left ventricular ejection fraction (LVEF) for detecting latent LV dysfunction. It can evaluate contractile reserve and other metrics such as functional capacity and exercise-induced pulmonary hypertension which may have prognostic value. An increase in the EROA of 13 mm3 or more, and an increase in PASP >60 mmHg at peak exercise predict an increase of mortality and morbidity [2,9].
Special situation
Acute MR
Acute ischaemic MR is more often due to complete or partial rupture of the papillary muscle, and less frequently due to an elongation of the muscle. The diagnosis of acute MR may not be easy and is often based on the use of TEE [3]. Clues for the diagnosis of acute MR by echocardiography include dense Doppler signals, a wide VC and high filling pressure despite normal LV cavity size. Careful visualisation of chordae and papillary muscles using off-axis views is crucial for the diagnosis and for identifying the mechanism. Partial rupture of papillary muscles can be missed and misdiagnosed as MV prolapse.
Echocardiography in mitral stenosis
Echocardiography (2D and 3D) via transthoracic and transoesophageal approaches plays an important role in the assessment of mitral valve disease (MVD). Echocardiography is considered as a class I diagnostic test indication in the latest AHA/ACC valvular heart disease guidelines [9] because it helps in:
- Verifying the diagnosis of MS and assessing its severity through both qualitative and quantitative assessment.
- Assessment of secondary effects on the LV, LA and right side.
- Providing a clear plan regarding the type and time of therapeutic strategy (medical, balloon valvuloplasty, surgical repair or replacement).
Echocardiographic assessment can be classified into qualitative, quantitative and semi-quantitative.
Qualitative assessment
This includes the morphological assessment of MV leaflets and subvalvular apparatus. This assessment helps in identification of the underlying aetiology of MS (organic [mainly rheumatic], or congenital). The main features can be summarised as follows:
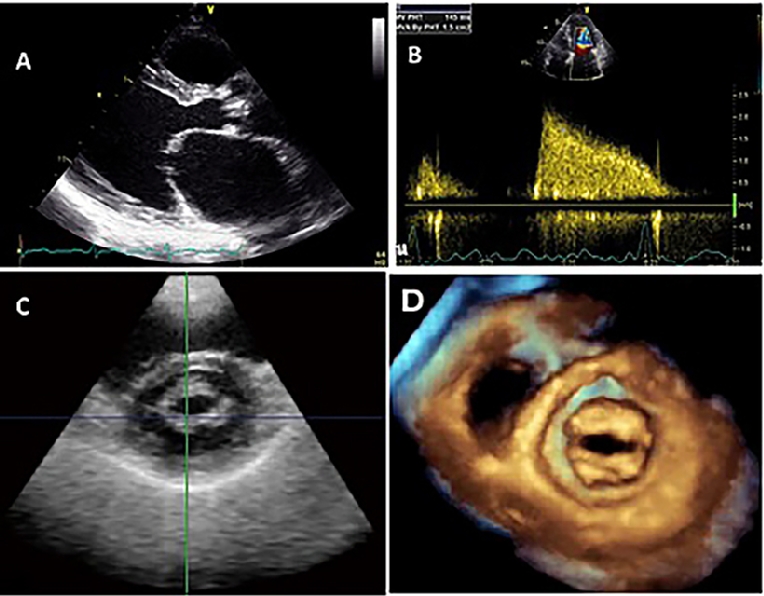
- In the parasternal long-axis view, the main diagnostic feature in rheumatic MS is the diastolic doming or hockey-stick shape of the anterior mitral leaflet (Figure 2A). This doming is due to the reduced mobility of the valve tips compared to the base of the leaflets. The extent of doming of the anterior leaflet can be assessed subjectively or objectively by the Reid grading system [10]. The posterior mitral leaflet motion is usually restricted.
- In the parasternal short-axis view of the MV, the leaflet thickening and fusion of commissures and chordae.
- Modified long-axis and 4‐chamber views are used to visualise the chordae and their abnormalities properly.
- Consequences of MS on other cardiac chambers such as left atrial dilatation, tricuspid regurgitation and also right ventricular function should be evaluated by echocardiography.
Quantitative assessment
This assessment helps in the grading of MS severity and identifying the stages (Table 1). The following parameters are mandatory:
- Measurement of mean pressure gradient across the MV in apical views. The gradient can be measured by tracing the dense outline of mitral diastolic inflow, and the mean pressure gradient is automatically calculated using the simplified Bernoulli equation = 4v2. Continuous wave Doppler is preferred (Figure 2B).
- Measurement of MV orifice area by 2D planimetry from the parasternal short-axis view is a reliable method. Direct tracing of the mitral orifice is performed including the commissures at the level of the tips when maximal excursion of the leaflets is seen (Figure 2C).
- Calculation of MV orifice area by pressure half-time (P1/2t) in an apical 4-chamber view using continuous wave Doppler. MVA is derived using the empirical formula: MVA = 220 / P1/2t. The continuity equation can be performed for calculation of MVA using the flow through the aortic valve and pulmonary valve with the formula: MVA = VTI LVOT x LVOT area / VTIMV Calculation of MVA using the PISA method is liable to contain errors due to multiple measurement. Both methods are rarely used unless necessary due to their significant limitations and liability to calculation errors.
- RV systolic pressure (RVSP) is typically estimated by continuous wave Doppler of tricuspid regurgitation in the apical 4-chamber view. Generally, RVSP increases with the severity of MS and can be used as a supportive parameter influencing prognosis and management. However, it can be normal or only mildly elevated even with severe MS. Severe MS is defined as MVA ≤1.5 cm2, diastolic P 1/2t ≥150 ms and elevated PASP >30 mmHg.
Post-balloon valvuloplasty, both qualitative and quantitative echo parameters are used to evaluate the outcome and to predict event-free survival.
Figure 2. Doming of the anterior MV leaflet in parasternal long-axis view (A), continuous Doppler tracing of MV inflow to measure the pressure gradient across it (B), 2D-planimetry of MVA obtained from parasternal short-axis view (C), and MV orifice by 3D echo (D).
Semi-quantitative assessment
2D echocardiography is very helpful to assess the anatomy and morphology of the MV including leaflet mobility and flexibility, leaflet thickness, leaflet calcification, subvalvular fusion, commissural fusion, and calcification. These morphological features are used by different scoring systems [11] to evaluate the suitability for percutaneous mitral balloon valvuloplasty (PMBV) and to predict success. The Wilkins score is widely used by interventionists (Table 2). Using the Wilkins score, the MV morphology is considered favourable if the score is ≤8.
Table 2. Semi-quantification of mitral valve morphology according to the Wilkins score.
| Grade | Mobility | Thickening | Calcification | Subvalvar thickening |
|---|---|---|---|---|
| 1 | Highly mobile valve with only leaflet tips restricted | Leaflets near normal in thickness (4–5mm) | A single area of increased echo brightness | A single area of increased echo brightness |
| 2 | Leaflet mid and base portions have normal mobility | Mid leaflets normal, considerable thickening of margins (5–8mm) | Scattered areas of brightness confined to leaflet margins | Scattered areas of brightness confined to leaflet margins |
| 3 | Valve continues to move forward in diastole, mainly from the base | Thickening extending through the entire leaflet (5–8mm) | Brightness extending into the mid portion of the leaflets | Thickening extending to the distal third of the chords |
| 4 | No or minimal forward movement of the leaflets in diastole | Considerable thickening of all leaflet tissue (>8–10mm) | Extensive brightness throughout much of the leaflet tissue | Extensive thickening and shortening of all chordal structures extending down to the papillary muscles |
Technical considerations
- With the excessive gain setting, MVA by 2D planimetry can be underestimated.
- Modal Doppler (most dense portion of the Doppler curve) should be used for calculation of pressure gradient.
- In case of a bimodal deceleration slope, tracing the deceleration slope in mid-diastole is preferable.
- In cases of a concave shape of the Doppler signal, measurement of P1/2t may not be feasible.
- If pulsed wave Doppler is used, the sample volume should be placed at the tip of the leaflets and not near to the annulus to avoid underestimation of the gradient.
- Colour flow Doppler can be used for better alignment with the flow direction.
- Calculation of MVA by P1/2t is not valid immediately after PMVB due to iatrogenic atrial septal defect.
- An average of 3-5 consecutive beats in sinus rhythm and 5-10 beats in atrial fibrillation should be performed to obtain the MVA by P1/2t. Heart rates of between 60 and 90/min give best results.
- Exaggerated peak gradient compared with the mean gradient is highly suggestive of associated MR.
- With rapid rise of LV diastolic pressure, e.g., severe aortic regurgitation, non-compliant LV, myocardial ischaemia, MVA is underestimated due to short P1/2t.
- Using a continuity equation for the calculation of MVA is not valid with significant MR and aortic regurgitation.
Additional information
For complete echo assessment to reach the final therapeutic strategy, it is necessary to assess the presence and severity of associated MR and to scan other valves for coexisting aortic and/or tricuspid stenosis and regurgitation.
Other echocardiographic modalities
Stress echocardiography
In asymptomatic patients or in patients in whom the symptoms and MS severity do not seem to correlate, stress echo (preferably exercise or alternatively dobutamine infusion) is indicated [12]. It provides additional information through assessing mitral gradients and pulmonary pressures during stress. An increase of mean diastolic gradient >15 mmHg and/or increase in PASP >60 mmHg is diagnostic for significant MS and the need for intervention [6].
Transoesophageal echocardiography
In general, TEE provides higher resolution and better assessment of the MV apparatus (especially chordae). With good image quality by TTE, the incremental value for TEE is little for the diagnosis and quantification of MS. With poor image quality, TEE can be relied on for diagnosis and grading of MS. The morphologic assessment of MV leaflets can be obtained from the mid-oesophageal level scanning from 0 degrees to 120 degrees while transgastric views from 90 degrees to 120 degrees is better for visualisation of chordae. Doppler measurements can be obtained from mid-oesophageal views. TEE has a crucial role in the exclusion of LA/LAA thrombus before planning balloon mitral valvuloplasty.
Three‐dimensional echocardiography
Three-dimensional echocardiography is useful in enhancing the objective assessment of MV morphology from a single imaging plane [12]. It enables visualisation of the narrowest orifice of the MV through better alignment of the image plane at the mitral tips (Figure 2D). The 3D-derived MVA is accurate and reproducible with excellent interobserver and intraobserver agreement. 3D echo allows detailed characterisation of the degree of MV involvement (leaflet motion and calcification and commissural fusion) and of the subvalvular apparatus (chordate shortening and fusion, papillary muscle fibrosis, necrosis and rupture). A validated scoring system by 3D echo can be used for the decision on balloon mitral valvotomy [11]. Post balloon valvotomy, 2D planimetry of the MVA by Doppler is limited and 3D echo can be used to visualise splitting of commissures and to measure the achieved MVA.
Special situation
Senile MS
Mitral annular calcification is relatively common in older patients. It most commonly occurs in the posterior part of the mitral annulus and extends to the posterior leaflet. In massive calcification, extension into the mitral leaflets can cause significant MS. Unlike rheumatic MS, the tips of the leaflets and commissures are not affected
Conclusion
MV disease is common and requires precise evaluation. The MV apparatus is complex and each component needs detailed evaluation for better understanding of MV dysfunction and for selecting the proper management strategy. Echocardiography provides sufficiently detailed images of the MV and is the most important diagnostic tool in establishing the diagnosis, depicting the severity of the lesion, and for appropriate clinical decision making. Using all of the available echo modalities (2D echo, 3D echo, stress echo) leads to increased accuracy of diagnosis and better outcome. In MR, the grade of severity can be accurately defined through an integrative approach.