


MITRAL STENOSIS
Fluid dynamics of mitral stenosis (Figure 1)
Figure 1. The stream lines of flow accelerate as they approach the stenotic orifice, with several curved proximal isovelocity surface areas. The mitral stenosis jet is long, with the post-jet disturbance occurring adjacent and distal to the laminar jet.
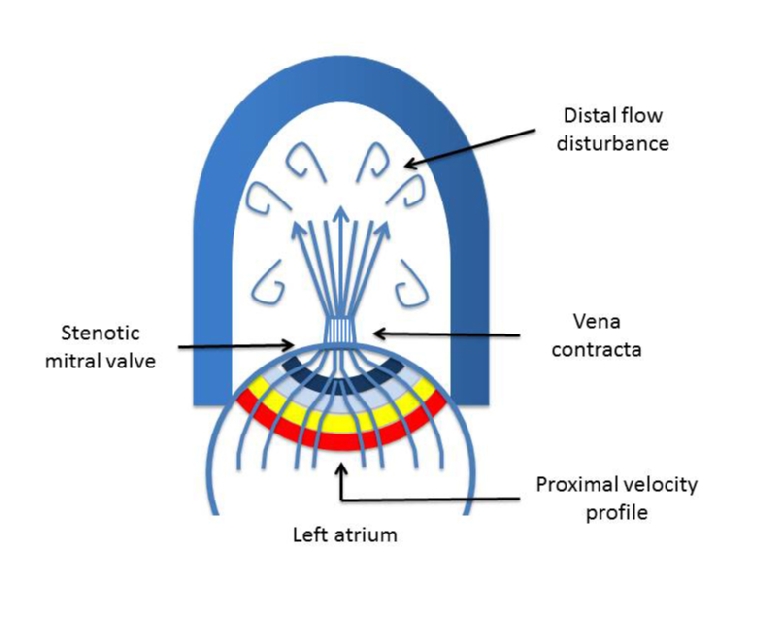
Proximal flow pattern
The spatial flow velocity profile proximal to a stenotic valve depends on valve anatomy, inlet geometry, and the degree of flow acceleration. In patients with mitral stenosis, the left atrium to left ventricle pressure gradient drives flow passively from the large inlet chamber (the left atrium) abruptly across the stenotic orifice. This produces a curved three-dimensional flow profile. Thus the proximal velocity profile of an atrioventricular valve is hemi-elliptical.
Stenotic area
At the level of the narrowed stenotic orifice, the fluid dynamics are characterised by the formation of a laminar high-velocity jet. The flow profile in cross-section at the origin of the jet is relatively flat and remains flat as the jet reaches the vena contracta which is the narrowest cross-sectional area slightly downstream from the anatomic orifice. As a rule, the narrowest cross-sectional area of flow (physiologic orifice area) is smaller than the anatomic orifice area.
Distal flow disturbance
Distal to the stenotic region, the flow becomes disorganised with multiple blood flow velocities and directions. The distance that this flow disturbance propagates downstream is related to stenosis severity.
Haemodynamic assessment of mitral stenosis
The assessment of mitral stenosis relies on measurement of the pressure gradient and on calculation of the valve area.
Transmitral pressure gradients
In pure mitral stenosis, the blood flow from the left atrium into the left ventricle is impaired, resulting in a pressure gradient between the two chambers during diastole. The most accurate way of determining the mitral valve gradient is the simultaneous recording of left atrial pressure provided by the transseptal technique together with left ventricular pressure obtained by retrograde catheterisation of the left ventricle. For practical reasons, in most cardiac catheterisation laboratories, evaluation of the transmitral gradient is frequently made with simultaneous pulmonary artery wedge pressure and left ventricular pressure. However, the mean pulmonary artery wedge pressure is an indirect measure of the left atrial pressure, thus the mean pulmonary artery wedge pressure/left ventricular pressure gradient frequently overestimates the true severity of mitral stenosis.
In clinical practice, the transmitral pressure gradient can be estimated non-invasively by measuring transmitral flow velocity with CW Doppler echocardiography and by applying the simplified Bernoulli equation:
ΔP=4v2
which allows highly accurate and reproducible calculation of peak pressure gradient (from peak velocity) and mean pressure gradient (that represents the mean of multiple instantaneous pressure gradients) [1]. This estimation is reliable, as shown by the good correlation with invasive measurement [2].
The peak gradient derives from peak velocity, which is influenced by left atrial compliance, left ventricular diastolic function, and loading conditions. Therefore, the mean gradient is the most relevant haemodynamic parameter in patients with mitral stenosis. However, the mean gradient is related not only to mitral valve area but also to other factors that influence transmitral flow rate, such as heart rate, cardiac output, and associated mitral regurgitation [3,4]. All these factors must be taken into consideration and, in particular, the heart rate at which pressure gradients are measured should always be reported.
Mitral valve area
Calculation of mitral valve area in the cardiac catheterisation laboratory is based upon the Gorlin formula:
MVA = (SV ÷ DFP) ÷ (C x 44.3 x [√ΔP])
where SV = stroke volume (mL per beat), DFP = diastolic filling period (sec per beat, since the antegrade flow across the mitral valve occurs only in diastole), ΔP = mean diastolic pressure gradient between the left atrium and left ventricle (mmHg), and 44.3 is equal to the square root of twice the gravity acceleration factor (980 cm/sec/sec). Basically, the Gorlin formula relates the transvalvular pressure gradient and the stroke volume and introduces an empirical constant (C = 0.85) accounting for orifice contraction and energy loss in order to align better with actual valve areas obtained at autopsy or surgery. The Gorlin formula is best applied to patients in sinus rhythm without mitral regurgitation, normal left ventricular function, and no other concomitant valve lesions. These factors are important in order to understand that calculated valve areas have clear limitations in the assessment of valvular stenosis.
Mitral valve area can be calculated by echocardiography using different approaches (Table 1).
Table 1. Echocardiographic parameters used to quantify mitral stenosis severity.
| Parameters | Method | Strengths | Limitations | Correlation |
|---|---|---|---|---|
| Mean gradient | Bernoulli equation | Simple | Affected by heart rate and flow conditions | |
| Valve area | Planimetry | Relatively flow-independent. Reference method | Difficult to measure the smallest area. Distorted/thickened valve post PBMV | Anatomical [5] |
| T1⁄2 | Functional MVA. Feasible in distorted mitral valves | Aortic regurgitation. Severe MR. High LVEDP immediately post PBMV | Invasive [8] | |
| PISA | Relatively flow-independent. Valid in case of AR and MR | Technically challenging. Angle correction. Not recommended for routine use | Cross-sectional [11] T1⁄2[11] Invasive [11] | |
| Continuity equation | Relatively flow-independent. Transmitral flow = aortic stroke volume | LVOT measurements. Atrial fibrillation. Mitral regurgitation. Aortic regurgitation | Invasive [12] | |
| PASP | Bernoulli equation | Simple | Arbitrary estimation of right atrial pressure |
Direct imaging (planimetry)
Direct measurement of the mitral valve orifice area is possible using two-dimensional (2D) echocardiography in the parasternal short-axis view and identifying the smallest orifice at the leaflet tips in mid-diastole. This approach is relatively load-independent and has been shown to have the best correlation with anatomical valve area as assessed on explanted valves [5]. Thus, it is considered the reference measurement of mitral valve area. However, mitral valve area may not be estimated accurately by 2D echocardiography in patients with extensively distorted and/or thickened mitral valves, especially after commissurotomy [6]. Three-dimensional (3D) echocardiography is more precise and reproducible for measuring the mitral valve area since it allows guidance to align the image in the plane of the minimal orifice at the leaflet tips [7].
Pressure half-time
As the mitral valve orifice area decreases, blood flow from the left atrium to the left ventricle becomes increasingly affected, and the time required for blood to flow from the left atrium to the left ventricle becomes longer. Thus, decreasing valve area is reflected in the length of time required for the pressure gradient across the mitral valve to fall during diastole. A measure of the rate of decay of the mitral valve gradient is the time interval in milliseconds between the peak of the Doppler-estimated transmitral pressure gradient and one half of the peak pressure gradient (pressure half-time - T1⁄2) [8].
Initial studies comparing Doppler T1⁄2 data with invasively determined Gorlin valve areas found that the decline of the velocity of diastolic transmitral blood flow is inversely proportional to valve area, using the empirical formula:
MVA=220/T1⁄2
This approach has been shown to correlate well with invasive valve areas in several clinical studies [8].
Because the T1⁄2 method estimates the functional mitral valve area, it can be applied even in patients with extensively distorted and/or thickened mitral valves as well as late after commissurotomy [6].
Limitations
- T1⁄2 is affected by any factor that changes either left atrial driving pressure (atrial septal defect, low left atrial compliance) or left ventricular compliance and pressure (abnormal relaxation, left ventricular hypertrophy) where the mitral valve area will be overestimated.
- In case of mitral stenosis associated with severe aortic regurgitation, left ventricular filling occurs both antegrade (across the mitral valve) and retrograde (across the aortic valve) and the T1⁄2 time may be "artificially" decreased, leading to an overestimation of the MV area.
- In other conditions in which left ventricular end-diastolic pressure is elevated, such as restrictive cardiomyopathy or ischaemic heart disease, the rate of equilibration between left atrium and left ventricle is increased, and the estimation of mitral valve area by T1⁄2 can also be falsely increased.
- The constant of 220 is proportional to the transmitral gradient and the left atrial/left ventricular compliance. In general, an increase in mean gradient is compensated by a decrease in compliance; however, this is not valid when gradient and compliance are subject to important and abrupt changes as immediately after balloon mitral commissurotomy, where there may be important discrepancies between the decrease in mitral gradient and the increase in compliance and thus the T1⁄2 method is not considered valid [9].
Proximal isovelocity surface area
The proximal isovelocity surface area (PISA) method is based on the continuity principle [10] and assumes that blood flow converging towards a flat orifice forms hemispheric isovelocity shells. The mitral valve area can be estimated using the principle of conservation of mass by analysing the PISA of the flow convergence on the atrial side [11]. This method is based on flow convergence analysis proximal to the stenotic orifice by shifting the colour flow scale baseline upward to decrease the colour aliasing velocity. With a hemispheric shape of the proximal isovelocity surface, the diastolic flow rate is calculated as:
Flow mitral (ml/s) = 2πr2 x (angle α/180) x Valias (cm/s)
Due to the doming of mitral leaflets in mitral stenosis, only a fraction of a hemisphere crosses the orifice and an angle correction factor (α= funnel angle formed by the mitral leaflets on the atrial side) needs to be considered.
Mitral valve area is then determined by dividing the maximal diastolic flow rate by peak continuous wave Doppler velocity of mitral inflow (Vmax [cm/s]) as follows:
MVA = 2πr2 x (angle α/180) x (Valias/Vmax)
Despite these theoretical advantages, in contrast to valvular regurgitation, the PISA method is seldom used in routine practice for the assessment of mitral stenosis severity. One reason may be that this method is reputed to be technically demanding and time-consuming since it requires several measurements, in particular an angle correction. However, if the aliasing velocity is high (Vr >40 cm/s), the angle correction can be neglected since the PISA approximates a hemisphere.
Continuity equation
The continuity equation can be used to estimate the mitral valve area when the transmitral flow is equal to the aortic stroke volume in the absence of significant regurgitation or shunts:
MVA = SV / VTIMSjet
Mitral valve area determined by the continuity equation method correlates with that determined by catheterisation [12].
Limitations
- Inaccuracy of LVOT diameter calculation.
- Atrial fibrillation (mitral and aortic stroke volume are calculated from different beats).
- Inaccuracy in case of mitral regurgitation (overestimation) or aortic regurgitation (underestimation).
CONSEQUENCES OF MITRAL STENOSIS
Changes in left atrial dimensions can be considered as backward consequences of mitral stenosis. Furthermore, the elevated left atrial pressures are transmitted to the pulmonary veins and the right side of the heart, leading to pulmonary hypertension over time. The degree of pulmonary hypertension is an indicator of the overall haemodynamic consequences of mitral stenosis; therefore, pulmonary pressures should be serially evaluated and followed in all patients with significant mitral stenosis.
GRADING MITRAL STENOSIS SEVERITY
Grading mitral stenosis should combine the measurements of valve area (using planimetry and T1⁄2) and mean gradient [4]. In case of discrepancy, planimetry is the reference method. When possible, the 3D-guided measurement of mitral valve area is recommended since it allows direct visualisation of the valve orifice in multiple planes. Current guidelines consider mitral stenosis significant when the mitral valve area is <1.5 cm2 [13,14].
Coexisting mitral regurgitation is common in patients with mitral stenosis and may elevate the transmitral pressure gradient (due to increased transmitral volume flow rate); however, both 2D echo and T1⁄2 valve area measurements remain accurate.
MITRAL REGURGITATION
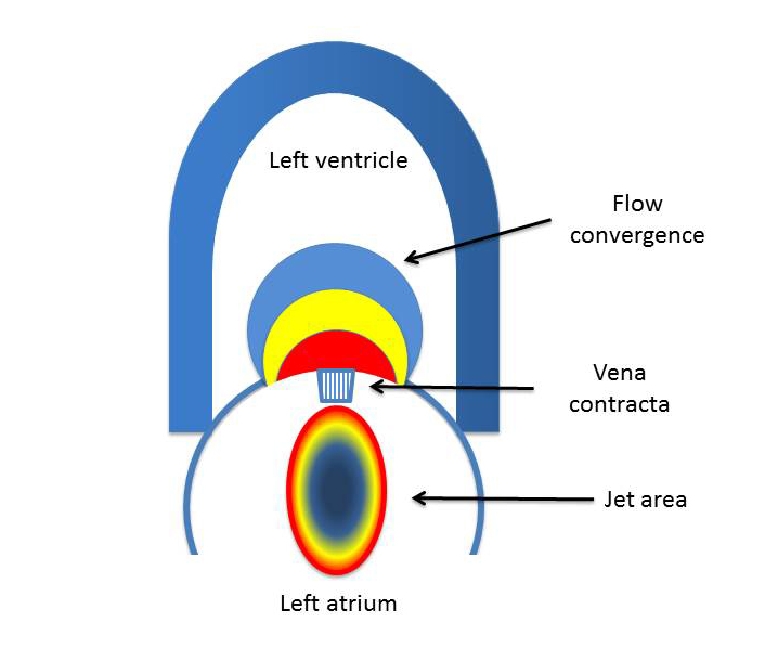
Fluid dynamics of mitral regurgitation (Figure 2)
The fluid dynamics of a regurgitant valve are, in many ways, similar to the fluid dynamics of a stenotic valve and are characterised by:
- Increased antegrade flow volume
- Proximal flow convergence region
- Regurgitant orifice
- High-velocity regurgitant jet
- Downstream flow disturbance
Figure 2. In case of mitral regurgitation, acceleration of flow occurs proximal to the valve plane leading to a series of isovelocity surfaces. Vena contracta is the narrowest portion of the regurgitant jet. Downstream flow disturbance is revealed by jet size and shape.
Echo-haemodynamic correlations in mitral regurgitation (Table 2)
Assessment of mitral regurgitation and its consequences on fluid dynamics is based on several echocardiographic parameters.
Table 2. Echocardiographic parameters used to quantify mitral regurgitation severity.
| Parameters | Strengths | Limitations |
| Peak E velocity | Simple | Affected by atrial pressure, atrial fibrillation, ventricular relaxation |
| PISA | Not affected by other valve leak. Quantitative estimates | Errors are squared. Affected by orifice shape. High inter-observer variability |
| Vena contracta | Relatively independent of haemodynamics. Can be used in eccentric jet | Not valid for multiple jets. Small measurement errors lead to large % errors |
| CW regurgitant jet | Simple | Qualitative |
| Colour flow | Good as screening | Influenced by technical and haemodynamic factors. Underestimates eccentric jets |
| Pulmonary vein flow | Relatively simple | Affected by left atrial pressure and atrial fibrillation |
Increased antegrade flow
Severe mitral regurgitation results in an increase in the antegrade volume flow rate across the mitral valve, which is reflected in an increase in the antegrade flow velocity across the valve. A peak velocity (E-wave) >1.5 m/sec suggests severe mitral regurgitation, provided that coexisting mitral stenosis is not associated.
Proximal flow convergence region
The flow convergence region is the zone of increased flow velocity before the regurgitant orifice and is probably the most important part of the jet when it comes to quantifying regurgitation as it may be used to measure the volume of regurgitation and the effective regurgitant orifice area directly. Similar to mitral stenosis, acceleration of flow occurs proximal to the valve plane leading to a series of isovelocity surfaces. Since the flow is constant, the area of the isovelocity surface decreases proximal to the mitral valve orifice, while the velocity increases.
The regurgitant volume flow rate (RFR) for a proximal isovelocity surface area (PISA) is:
Regurgitant flow rate (RFR) = PISA x Valias (cm/sec),
where PISA = 2πr2 and the aliasing velocity is derived from a clear red-blue interface of the isovelocity surfaces.
Regurgitant orifice area
We can then apply the continuity equation by using the area of the hemisphere of flow convergence and its velocity to calculate the area of the effective regurgitant orifice area (EROA), since we also know the peak mitral regurgitant velocity. Maximum instantaneous effective regurgitant orifice area (EROAmax) is estimated by dividing the regurgitant flow rate by the maximum velocity of the regurgitant jet:
EROAmax = RFR / VMRjet
Regurgitant volume can then be calculated by multiplying EROA by the velocity time integral of the regurgitant jet:
RV = EROA x VTIMRjet
The method is the most recommended quantitative approach for mitral regurgitation severity assessment, whenever feasible [15]. 3D echocardiography allows direct measurements and potentially more accurate EROA and regurgitant volume calculations; however, as this is a relatively new technique awaiting validation, it has not been included in the current guidelines.
Limitations
- Calculation of EROA by PISA is based on the assumption that the flow convergence region has a round orifice through a hemispherical surface. Thus, the PISA method may have limitations in eccentric jets and elliptical or complex regurgitant orifice shapes as in patients with secondary mitral regurgitation where the geometry of the proximal convergence zone is often asymmetrical and true EROA will be underestimated [16]. These findings could explain why the threshold used to define a severe functional mitral regurgitation is inferior to that used for organic mitral regurgitation.
- PISA radius measurement is performed on a still frame and provides only an instantaneous regurgitant flow rate and orifice area.
- Since mitral regurgitation is a dynamic entity, care should be taken in analysing the variation of the PISA radius during systole. In mitral valve prolapse, mitral regurgitation starts in mid-systole and the PISA radius increases progressively, with a maximum during the second half of systole. In contrast, in secondary mitral regurgitation, PISA radius decreases in mid-systole as compared to early and late systole, reflecting the variation of transmitral pressure gradient that tends to close more efficiently the mitral leaflets in mid-systole [17], which may lead to underestimation of mitral regurgitation severity. In degenerative and rheumatic mitral regurgitation, the PISA radius is often constant throughout systole.
Vena contracta
Vena contracta, defined as the narrowest portion of a regurgitant jet that occurs at or just downstream from the orifice, mirrors very closely the regurgitant orifice area [18], with the advantage that it is independent of volume flow rate and driving pressure. The concept of vena contracta is based on the assumption that the regurgitant orifice is almost circular. While this is true in primary mitral regurgitation, in secondary mitral regurgitation the regurgitant orifice is commonly elliptical [19]. Thus, when secondary mitral regurgitation is suspected, a correct 2D assessment of vena contracta width implies averaging measurements using two orthogonal planes. A 2D vena contracta width ≥7 mm (>8 mm for biplane) indicates severe mitral regurgitation.
3D echocardiography allows manual planimetry of the vena contracta area from a volumetric data set that can be cropped. The vena contracta area as assessed by 3D echocardiography has proven more accurate in the evaluation of secondary mitral regurgitation and non-symmetrical regurgitant orifices [20]. Using the 3D vena contracta area, severe mitral regurgitation could be defined as an area of 0.41 cm2, irrespective of mitral regurgitation aetiology [21].
High-velocity regurgitant jet
Several types of information regarding the severity of mitral regurgitation can be derived from the spectral display of the CW Doppler signal.
Signal intensity is proportional to the number of blood cells contributing to the regurgitant signal. Thus, a weak signal reflects mild mitral regurgitation, whereas a dense signal with a full envelope indicates more severe mitral regurgitation than a faint signal.
The shape of the velocity curve depends on the time-varying pressure gradients across the regurgitant mitral valve. In patients with mitral regurgitation, the LV-to-LA gradient in systole is 85 to 135 mmHg. Thus, the mitral regurgitation velocity curve typically shows a maximum velocity of 5 to 6 m/sec and the velocity itself does not correlate with the severity of the mitral regurgitation. An increase in end-systolic left atrial pressure results in a late-systolic decline in the instantaneous pressure gradient and in the instantaneous velocity.
Downstream flow disturbance
Jet size and shape
Colour flow Doppler is an important step for detecting/ruling out the presence of mitral regurgitation; however, severity assessment of mitral regurgitation should never be based on colour flow Doppler only. In fact, jet size is not reliable because it is strongly dependent on colour gain and colour aliasing settings as well as being affected by left atrial compliance. In particular, this method leads to underestimation of severity in eccentric jets because they are prone to impinge on the left atrial wall (Coanda effect) [15].
Systolic pulmonary flow reversal
The flow pattern in the pulmonary veins is altered in mitral regurgitation. Two factors are responsible for this change: a) elevated left atrial pressure, and b) reverse flow into the left atrium during systole. This causes either blunted or reverse systolic flow in the pulmonary veins [22]. However, interpretations must be made with caution because a false negative may occur in case of high atrial compliance, and a false positive can occur in eccentric mitral regurgitant jets where a selective systolic flow reversal into one of the pulmonary veins is seen, even if the mitral regurgitation is only moderate.
Associated findings in mitral regurgitation
Severe mitral regurgitation also has an impact on the chambers and function of the heart. The size and function of the left ventricle are indicators of the severity of mitral regurgitation. Although the left atrium is usually dilated, its size cannot be used to quantify the severity of mitral regurgitation because it also depends on the compliance of the left atrium, the presence of atrial fibrillation, diastolic dysfunction, and other aspects.
Another factor to look for is pulmonary pressure. Mitral regurgitation is relevant when pulmonary pressure is high (in the absence of other causes of pulmonary hypertension). Conversely, the absence of pulmonary hypertension does not exclude severe mitral regurgitation.
Grading secondary mitral regurgitation severity
The 2003 ASE guidelines considered mitral regurgitation severe if EROA is ≥40 mm2 and regurgitant volume ≥60 mL/beat [23]. More recently, the 2014 AHA/ACC and the 2017 ESC/EACTS guidelines have proposed a lower cut-off value of ≥20 mm2 for EROA and ≥30 mL/beat for regurgitant volume to define severe secondary mitral regurgitation [14,24]. The rationale for this recommendation is based on the results of outcome studies in secondary mitral regurgitation patients, showing an adverse prognosis when EROA is ≥20 mm2. Although severe mitral regurgitation (RF ≥50%) at lower levels of EROA and regurgitant volume than previously considered is possible, redefining mitral regurgitation severity purely on EROA may cause significant clinical problems. In fact, values defining severe mitral regurgitation in individual patients depend on multiple factors, including left ventricular end-diastolic volume (LVEDV), left ventricular ejection fraction (LVEF), and the pressure gradient between the left ventricle and left atrium.
Proposed changes to the partial definition of severe secondary mitral regurgitation from an EROA of 40 to 20 mm2 and a regurgitant volume of 60 to 30 mL should be applied cautiously in clinical practice. As the guidelines emphasise, defining severe mitral regurgitation requires careful integration of all echocardiographic and clinical data, as measurement of EROA is imprecise and poorly reproducible [25].