In order to bring you the best possible user experience, this site uses Javascript. If you are seeing this message, it is likely that the Javascript option in your browser is disabled. For optimal viewing of this site, please ensure that Javascript is enabled for your browser.
Did you know that your browser is out of date? To get the best experience using our website we recommend that you upgrade to a newer version. Learn more.

How to measure the aorta in the setting of genetic aortic disease

Julie De Backer1, Laura Muiño-Mosquera2 and Laurence Campens1

Ghent University Hospital Belgium, VASCERN HTAD European Reference Centre


1 Department of Cardiology

2 Department of Pediatrics, division of Pediatric Cardiology

Definition of aortic dilatation

In the context of genetic diseases of the aorta, a correct definition of aortic pathology is needed both in terms of diagnosis and treatment. When considering further work-up for genetic causes, it is important to define aortic dilatation and -aneurysm. Aortic dilatation in most genetic aortic disease entities is typically located at the root, at the level of the sinuses of Valsalva and is defined as a measured aortic diameter above the 95% confidence interval of the normal distribution in a large reference population. (1) (2).

To correlate measured aortic diameters with normal values, age- and body surface area (BSA)-related nomograms for upper limit of normal (ULN) or equations for z-score calculation should be used. The z-score is a standard numerical representation on how much a specific value defers from the average in a normalized distribution. A z-score of 0 means that the studied value coincides with the mean. Normal z-scores range from -2 to +2 standard deviations. Positive z-scores indicate that the value is above average while negative z-scores indicate that the value is below average. The z-score can be calculated using the formula z=(x- µ)/ σ  were x is the studied value, µ is the mean and σ the standard deviation. A z-score ≥2 indicates a value exceeding two standard deviations (the 95% confidence interval).

Z-scores correlate with percentiles. Percentiles show the ranking of a value in a set of 100 equal parts. A z-score of 0 corresponds to the 50th percentile while z-scores of 2 and 3 correspond to the 97,7th and 99,9th percentile respectively. The upper limit of normal (ULN) is usually set at the 95th percentile.

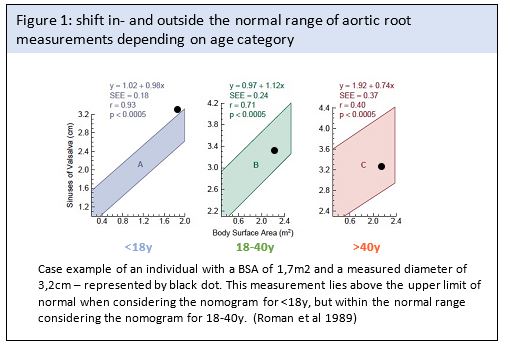
The first nomograms for normalizing aortic root diameters (at the level of the sinuses of Valsalva and the supra-aortic ridge) with 2D echocardiography were established by Roman and colleagues in 1989 (3) . In this study 135 adults and 52 children were included and the ULN was defined based on BSA. These nomograms, which are widely used in clinical practice and adopted in guidelines, made a subdivision in three different age categories, leading to jumps in diameter prediction when transitioning from one age category to the next one, as illustrated in figure 1.

Fig 1 Backer.JPG


This problem was resolved in the updated nomograms by the same group for aortic root ULN

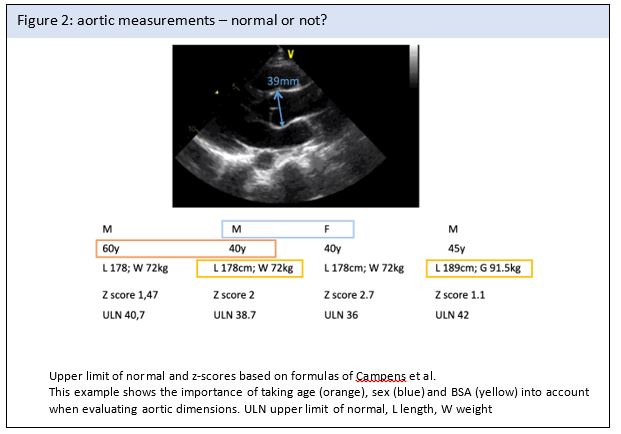
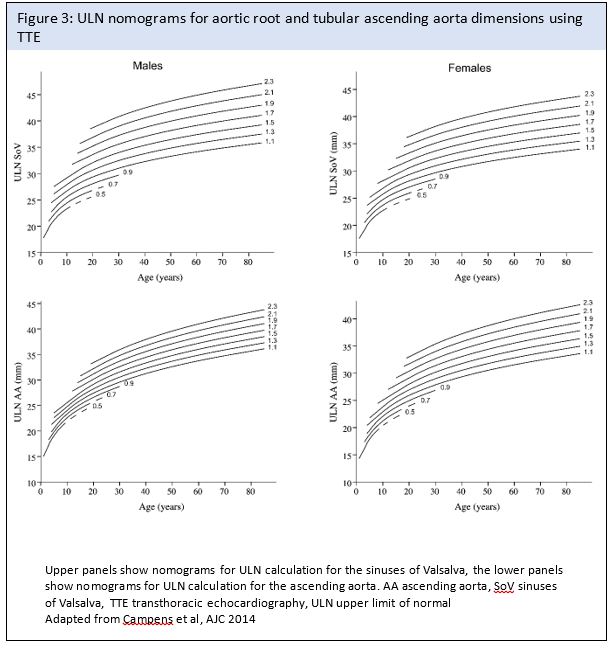
prediction, considering age as a continuous variable(4). Meanwhile, several other aortic nomograms have been developed. Nomograms are derived from regression equations including age, sex and bsa as the most common variables. Figure 2 illustrates the importance of taking these factors into account and an illustration of nomograms in which obtained values can be correlated with expected values is provided in Figure 3 (Figure 2&3).

Fig 2 Backer.JPG

Figure 3 Backer.JPG

Table 1: Overview of the different published nomograms for z-score calculation


Subjects included Method used to measure the aorta Variables used in the regression equations Reference

N= 496

Age: 1day- 20yrs

Inner to inner in systole BSA (Haycock), Age, Sex Sluysmans et al. 2005 (6)

N=3215

Age: 1day-18yrs

Inner to inner in systole

BSA (Haycock), Age, Sex

Lopez et al. 2017 (7)

N= 780

Children

Inner to inner in systole

BSA (Haycock),

Age

Sex

Pettersen et al. 2008 (8)

N=353

Children

Leading edge to leading edge in diastole BSA (Haycock) Gautier et al. 2012 (9)

N=1334

Age: ≥15 yrs

Leading edge to leading edge in diastole

BSA (Dubois), Age, Sex

Devereux et al. 2012 (4)

N=1334

Age: ≥15 yrs

Leading edge to leading edge in diastole Age, Sex, Height Devereux et al. 2012 (4)

N=849

Age: 1-85yrs

Leading edge to leading edge in diastole

BSA (Haycock),

Age

Sex

Campens et al. 2014 (5)

N=1151

Age: 1day-17yrs

Maximum systolic dimension BSA (Haycock) Cantinotti et al. 2017 (10)


As shown in table 1, a major limitation in using these nomograms, is that most groups have limited their calculation to either pediatric or adult populations. More recently z-score and ULN formulas further extending the age range included both children and adults allowing for a unified interpretation throughout growth and aging. This paper also provides normative data on the tubular ascending aorta (5).

In addition to matching for age, sex and BSA, the method used to measure the aorta is equally important when comparing and calculating z-scores. This is especially true in the pediatric population where different ways of measuring the aorta are used and multiple nomograms exist. An illustration of this problem is given in Figure 4.

Fig 4 Backer.JPG

Limitations of the z-score equations and alternative calculations

In addition to the pitfalls mentioned above, calculation of z-scores are limited by the fact that not all ethnic groups are equally represented in the nomograms (most of the included patients were Caucasian) and the fact that over- or underweight can lead to an over or underestimation of the z-score as illustrated in Figure 5 (11)

Fig 5 Backer.JPG

Furthermore, the z-score obtained by different nomograms, even when appropriately used, can lead to a different z-score and subsequently different clinical interpretation. This was shown by Rutten and colleagues in a study of children with Marfan syndrome where the percentage of children with a z-score ≥ 2 changed depending on the nomogram used (35% using Lopez et al. versus 20% using Pettersen et al.) (12)


Current practice of state-of-the-art measurement of the aorta

Transthoracic echocardiographic views

Echocardiographic images are obtained from the parasternal long-axis view visualizing the aortic root and the proximal ascending aorta. Different transducer positions are often needed to optimize the images: a high left parasternal view located one or two intercostal spaces superior to the standard location may be required. Alternatively, a high right parasternal view in a right lateral decubitus position may better display the entire proximal aorta. 

How to measure

Measurements of the aortic root and tubular ascending aorta are taken at different levels: (1) the aortic valve annulus (defined as the hinge points of the aortic leaflets); (2) the maximal diameter at the sinuses of Valsalva; (3) the sinotubular junction (transition between the sinuses of Valsalva and the tubular portion of the ascending aorta); and (4) the ascending aorta at the level of the right pulmonary artery. In some patients aortic root dilatation is asymmetric. This can for instance be the case in patients with an underlying connective tissue disorder and in patients with a bicuspid aortic valve (especially patients with right and non-coronary cusp fusion). Dimensions in such cases can be inaccurate. The transverse plane of the aorta (parasternal short-axis view) may be of help to reveal this asymmetry, but also given the low lateral resolution, cross-sectional imaging with CMR or CTA is needed for accurate measurement (13).

When measuring aortic diameters, it is important to obtain the maximum diameter recorded perpendicular to the long axis of the vessel in that view. According to the current adult quantification guidelines all aortic measurements should be made at end-diastole using the leading-to-leading edge convention (DLE), except for annular measurements which should be performed at mid-systole from inner to inner edge (SIE) (14) (Figure 6). Pediatric guidelines on the other hand advise to measure all root and ascending aortic dimensions from SIE (15). These different recommendations can be challenging particularly in the transition of care from pediatric to adult cardiology departments. However, when comparing the two conventions only a non-significant underestimation of the diameter with the SIE compared to the DLE convention can be observed - indicating that both conventions can be interchangeably used in the adolescent age group(16) (17). The main reasons why adult guidelines recommend the DLE convention are (1) the fact that available normative data for aortic dimensions as well as recommendation thresholds for elective root and/or ascending aorta replacement are mostly based on the DLE method (3) (18) (2) (19)  – use of another method may adversely affect patient prognosis by delaying surgery and (2) measuring in diastole provides better reproducibility due to stable hemodynamics. M-mode measurements, as performed in earlier days, are no longer considered adequate for aortic root measurements due to motion of the heart during the cardiac cycle and changes in M-mode cursor location relative to the maximum diameter of the sinuses of Valsalva (14). This can result in a systematic underestimation (by up to 2 mm) of aortic diameter by M-mode in comparison with the 2D measurements of aortic diameter(3).

Fig 6 Backer.JPG

Comparison of methods for aortic measurements and dimensions obtained by CTA, CMR versus TTE

Differences in diameters obtained by the different imaging modalities can be expected for several reasons, (1) CTA and CMR show all dimensions of the aorta whereas TTE is inherently limited to its 2 dimensional view on the aorta which may not necessarily reflect the maximum aortic root diameter especially not in asymmetric aortic roots (20) and (2) there is no uniform method for measuring the aortic root and tubular ascending aorta among TTE, CTA and CMR. TTE uses the leading edge-to-leading edge convention, whereas CTA and CMR use the inner edge-to-inner edge or outer edge-to-outer edge convention(14). In CTA and CMR imaging, aortic measurements should be obtained on ECG-gated images, in end-diastole, using the double oblique methodology (21) (Figure 7).

Fig 7 Backer.JPG

For the measurement of the sinus of Valsalva three methods have been proposed: sinus-to-commissure (bisecting cuts), center sinus-to-sinus (off-center cuts) or maximum sinus-to-sinus (off-center cuts) measurement assessed in diastole, inner-to-inner edge (I-I) in the short axis view (figure 8). It remains unclear which of these methods is of most clinical relevance.  Nevertheless it is clear that the same method should consistently be used during the follow-up of each individual patient (22). The dimensions obtained by the maximum I-I sinus-to-sinus method dimensions are significantly greater compared to the other two methods(21, 23, 24). This method furthermore yields the best agreement with DLE TTE measurements, and particularly the maximum I-I sinus-to-sinus measurements of the right-to-non-coronary cups most closely agrees when assessed by CTA(23). Similarly Rodriguez-Palomares et al. showed that the diameter by DLE TTE correlated best with the I-I right-to-non-coronary cusp diameter determined by both CTA and CMR – of note the center sinus-to-sinus method was used for sinus-to-sinus measurements(21). Despite the close agreement there still exists an underestimation of diameters by TTE of about 2 to 3mm(21). Rodriguez-Palomares and colleagues demonstrated a minimal difference of 0.2 to 1.2mm (mid sinus-sinus technique used), whereas Frazao and colleagues found a 1.4 to 3.5mm difference (max sinus­­-sinus technique used) (25). Figure 9 summarizes the recommendations for measurements of the sinuses of Valsalva and tubular ascending aorta with different imaging modalities.

Fig 8 Backer.JPG

Fig 9 Backer.JPG

Conclusion

The importance of correct measurement of the aorta in the context of hereditary diseases of the aorta cannot be underestimated. In a diagnostic setting, z-scores correcting for age, BSA and gender are usually used and correct reference values should be used. To determine indications for surgery, the absolute diameter of the aorta is usually used and, here too, the correct technique and measurement method should be used.

In this paper we have focused on measurements of the aortic root - of course the distal aorta cannot be ignored and additional parameters such as arterial tortuosity and functional characteristics such as stiffness can also be used to better assess the diagnosis and risk.

References


  1. Johnston KW, Rutherford RB, Tilson MD, Shah DM, Hollier L, Stanley JC. Suggested standards for reporting on arterial aneurysms. Subcommittee on Reporting Standards for Arterial Aneurysms, Ad Hoc Committee on Reporting Standards, Society for Vascular Surgery and North American Chapter, International Society for Cardiovascular Surgery. J Vasc Surg. 1991;13:452–58.
  2. Hiratzka LF, Bakris GL, Beckman JA et al. 2010 ACCF/AHA/AATS/ACR/ASA/SCA/SCAI/SIR/STS/SVM guidelines for the diagnosis and management of patients with Thoracic Aortic Disease: a report of the American College of Cardiology Foundation/American Heart Association Task Force on Practice Guidelines, American Association for Thoracic Surgery, American College of Radiology, American Stroke Association, Society of Cardiovascular Anesthesiologists, Society for Cardiovascular Angiography and Interventions, Society of Interventional Radiology, Society of Thoracic Surgeons, and Society for Vascular Medicine. Circulation. 2010.
  3. Roman MJ, Devereux RB, Kramer-Fox R, O'Loughlin J. Two-dimensional echocardiographic aortic root dimensions in normal children and adults. AJC. 1989;64:507–12.
  4. Devereux RB, de Simone G, Arnett DK et al. Normal limits in relation to age, body size and gender of two-dimensional echocardiographic aortic root dimensions in persons ≥15 years of age. American Journal of Cardiology. 2012;110:1189–94.
  5. Campens L, Demulier L, De Groote K et al. Reference values for echocardiographic assessment of the diameter of the aortic root and ascending aorta spanning all age categories. American Journal of Cardiology. 2014;114:914–20.
  6. Sluysmans T, Colan SD. Theoretical and empirical derivation of cardiovascular allometric relationships in children. J Appl Physiol (1985). 2005;99:445–57.
  7. Lopez L, Colan S, Stylianou M et al. Relationship of Echocardiographic Z Scores Adjusted for Body Surface Area to Age, Sex, Race, and Ethnicity: The Pediatric Heart Network Normal Echocardiogram Database. Circ Cardiovasc Imaging. 2017;10
  8. Pettersen MD, Du W, Skeens ME, Humes RA. Regression equations for calculation of z scores of cardiac structures in a large cohort of healthy infants, children, and adolescents: an echocardiographic study. Journal of the American Society of Echocardiography: official publication of the American Society of Echocardiography. 2008;21:922–34.
  9. Gautier M, Detaint D, Fermanian C et al. Nomograms for aortic root diameters in children using two-dimensional echocardiography. American Journal of Cardiology. 2010;105:888–94.
  10. Cantinotti M, Giordano R, Scalese M et al. Nomograms for two-dimensional echocardiography derived valvular and arterial dimensions in Caucasian children. J Cardiol. 2017;69:208–15.
  11. Braley KT, Tang X, Makil ES, Borroughs-Ray D, Collins RT. The impact of body weight on the diagnosis of aortic dilation-misdiagnosis in overweight and underweight groups. Echocardiography. 2017;34:1029–34.
  12. Rutten DWE, Aarts-Janssen IJH, Kempers MJE et al. Comparability of different Z-score equations for aortic root dimensions in children with Marfan syndrome. Cardiol Young. 2021;31:1962–68.
  13. Vis JC, Rodríguez-Palomares JF, Teixidó-Tura G et al. Implications of Asymmetry and Valvular Morphotype on Echocardiographic Measurements of the Aortic Root in Bicuspid Aortic Valve. J Am Soc Echocardiogr. 2019;32:105–12.
  14. Lang RM, Badano LP, Mor-Avi V et al. Recommendations for cardiac chamber quantification by echocardiography in adults: an update from the American Society of Echocardiography and the European Association of Cardiovascular Imaging. Journal of the American Society of Echocardiography: official publication of the American Society of Echocardiography. 2015;28:1–39.e14.
  15. Lai WW, Geva T, Shirali GS et al. Guidelines and standards for performance of a pediatric echocardiogram: a report from the Task Force of the Pediatric Council of the American Society of Echocardiography. J Am Soc Echocardiogr. 2006;19:1413–30.
  16. Servato ML, Teixidó-Turá G, Sabate-Rotes A et al. Are Aortic Root and Ascending Aorta Diameters Measured by the Pediatric versus the Adult American Society of Echocardiography Guidelines Interchangeable. J Clin Med. 2021;10:5290.
  17. Muraru D, Maffessanti F, Kocabay G et al. Ascending aorta diameters measured by echocardiography using both leading edge-to-leading edge and inner edge-to-inner edge conventions in healthy volunteers. Eur Heart J Cardiovasc Imaging. 2014;15:415–22.
  18. Vasan RS, Larson MG, Benjamin EJ, Levy D. Echocardiographic reference values for aortic root size: the Framingham Heart Study. J Am Soc Echocardiogr. 1995;8:793–800.
  19. Erbel R, Aboyans V, Boileau C et al. 2014 ESC Guidelines on the diagnosis and treatment of aortic diseases: Document covering acute and chronic aortic diseases of the thoracic and abdominal aorta of the adult. The Task Force for the Diagnosis and Treatment of Aortic Diseases of the European Society of Cardiology (ESC). European Heart Journal. 2014..
  20. Plonek T. Short-axis view in transthoracic echocardiography for the evaluation of the aortic root maximum dimension. J Thorac Cardiovasc Surg. 2019;157:e123.
  21. Rodríguez-Palomares JF, Teixidó-Tura G, Galuppo V et al. Multimodality Assessment of Ascending Aortic Diameters: Comparison of Different Measurement Methods. J Am Soc Echocardiogr. 2016;29:819–826.e4.
  22. Hanneman K, Chan FP, Mitchell RS, Miller DC, Fleischmann D. Pre- and Postoperative Imaging of the Aortic Root. Radiographics. 2016;36:19–37.
  23. Suzuki M, Mori S, Izawa Y et al. Three-dimensional volumetric measurement of the aortic root compared to standard two-dimensional measurements using cardiac computed tomography. Clin Anat. 2021;34:333–41.
  24. Burman ED, Keegan J, Kilner PJ. Aortic root measurement by cardiovascular magnetic resonance: specification of planes and lines of measurement and corresponding normal values. Circ Cardiovasc Imaging. 2008;1:104–13.
  25. Frazao C, Tavoosi A, Wintersperger BJ et al. Multimodality Assessment of Thoracic Aortic Dimensions: Comparison of Computed Tomography Angiography, Magnetic Resonance Imaging, and Echocardiography Measurements. J Thorac Imaging. 2020
The content of this article reflects the personal opinion of the author/s and is not necessarily the official position of the European Society of Cardiology.